It’s a familiar ritual for many entrepreneurs and managers: the end of the month approaches, and it’s time to “pull the reports.” This means hours spent logging into a multitude of platforms – Google Analytics, Facebook Business, your CRM, your newsletter software – only to copy-paste figures into an Excel spreadsheet. The result? A static report that took valuable time to compile and is already obsolete by the time you present it.
In 2025, this working method is no longer viable. Decision-making must be fast and based on fresh data. The solution is to switch from manual reports to smart, automated dashboards.
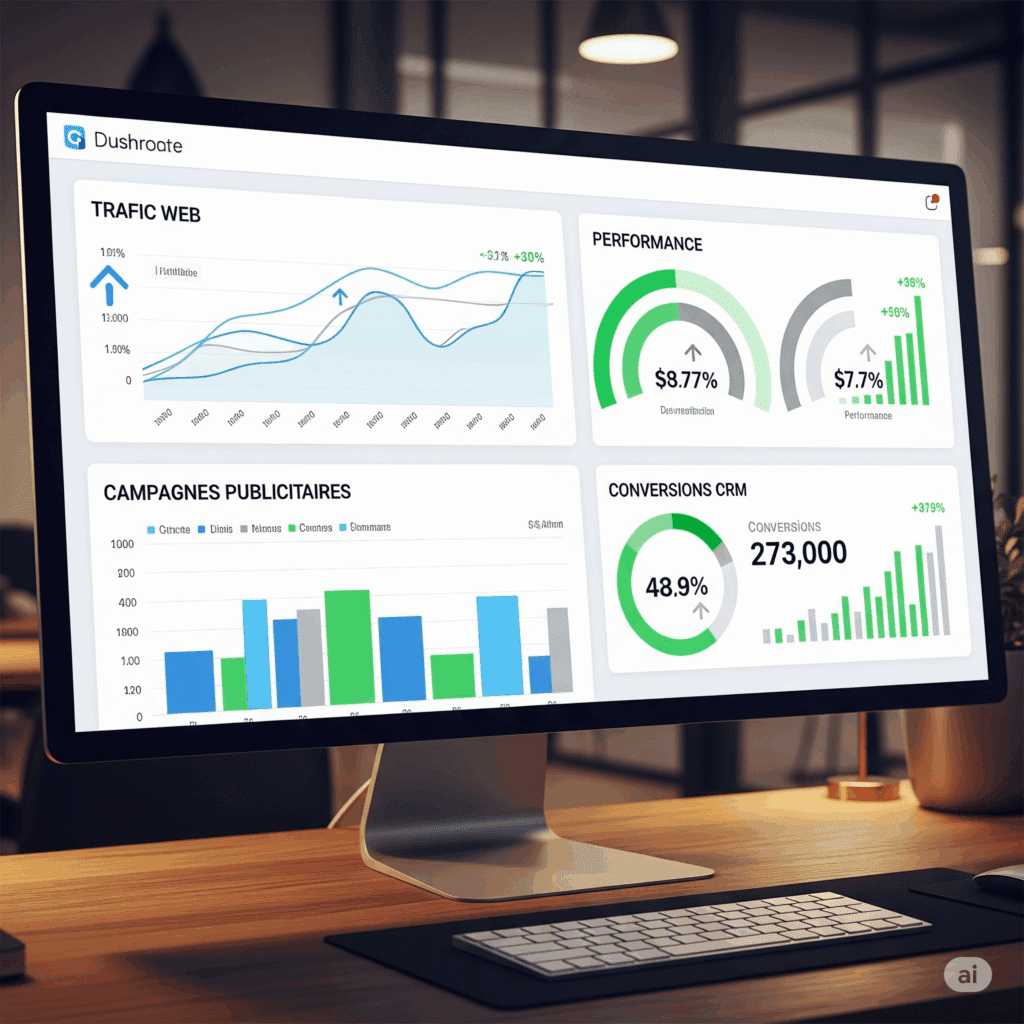
A smart dashboard is a visual tool that centralizes your key performance indicators (KPIs) in real time. Once configured, it updates automatically, without any intervention from your side. It is one of the services we offer for faster decision-making.
1. Real-Time Data for Instant Decisions
The biggest flaw of a manual report is its time lag. The figures you analyze reflect the past, sometimes distant. An automated dashboard, however, is continuously connected to your data sources. You can see the performance of your advertising campaign today, not last week’s.
This allows you to react instantly. Is an ad not performing? You can cut the budget immediately. Is a page on your site converting exceptionally well? You can direct more traffic to it immediately. You switch from a reactive to a proactive mode.

2. Centralize all your Data in one Place
No more juggling between ten different tabs. A smart dashboard can aggregate data from all your platforms into a single, coherent view. Imagine being able to see on a single screen:
- Your website traffic (Google Analytics).
- The performance of your ads (Google Ads, Meta Ads).
- Engagement on your social media.
- The number of leads generated (your CRM).
- The open rate of your newsletters (ActiveCampaign).
This 360-degree view allows you to understand the cause-and-effect relationships between your various marketing actions, which is impossible when data is analyzed in silos.
3. Identify Trends (and Problems) at a Glance
The human brain is much better at interpreting visual information than tables of numbers. Smart dashboards transform your raw data into easy-to-understand graphs, gauges, and heatmaps.
At a glance, you can spot an upward trend, identify a problem before it worsens, or compare the performance of different campaigns. This automated monitoring alerts you to what requires your attention.
4. Free up your Time for True Strategic Analysis
Data compilation is a low-value task. Your expertise as a manager lies not in your ability to copy-paste, but in your ability to interpret data to make strategic decisions.
By automating data collection and presentation, you free up hours each month. This time can be reinvested in what truly matters: analyzing trends, planning your next campaign, speaking with your clients, and growing your business.
Conclusion: Work on your Business, not on your Reports
Implementing a smart dashboard is one of the most profitable investments you can make to optimize your time and improve your decision-making. It’s an essential step to move from “gut feeling” management to data-driven management.


